In this article, we will talk about a Do-It-Yourself approach towards election analysis and coming to a conclusion whether the elections were conducted fairly or not.
By Rajat Gupta, Data Science Practitioner
Fair elections are the foundation of democracy where every citizen is heard and accounted for in electing the best set of public servants.
Several candidates put forward their vision and strategy for the betterment of their people.
Organizations like Election Commission of India and Federal Election Commission (USA) make sure that the integrity of elections is maintained and polls are conducted in the most unbiased and fair manner, thus, keeping the democratic functioning well and alive for the common good.
However, after every election there are numerous allegations that somehow the winning party cheated. As appalling as it is, the integrity of ECI, FEC and the likes is often questioned on numerous fronts.
In this article, we will talk about a Do-It-Yourself approach towards election analysis and coming to a conclusion whether the elections were conducted fairly or not.
What we need
- Understanding of Benford’s Law
- Electoral Data
- MS Excel or similar software
1. Benford’s Law
Nature, shapes of trees, cloud formations, distribution of natural resources, etc, often seems random.
However, nature is comprised of fascinating mathematical patterns.
One such example is of Fibonacci numbers which are studied widely and have been associated with numerous natural phenomenons and beings.
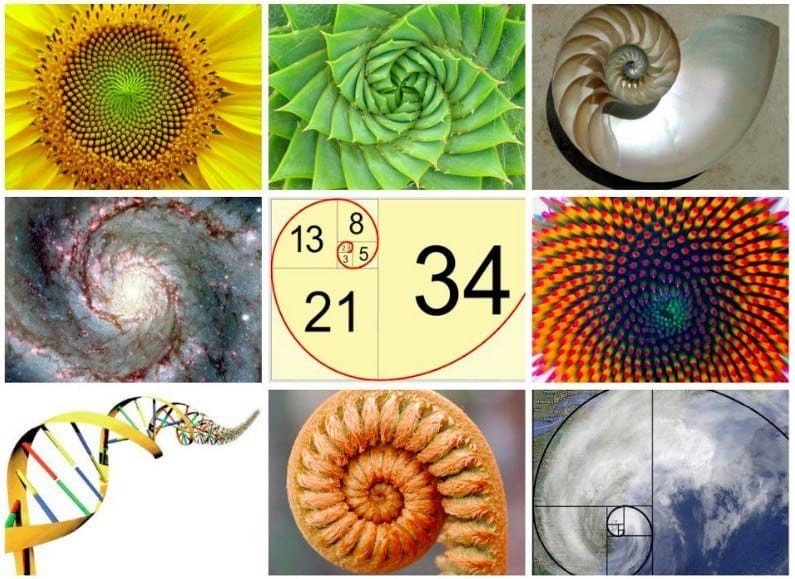
Similarly, there is another fascinating mathematical existence in nature also known as Benford’s Law that defies randomness.
Under Benford’s Law, the first digits of the numbers in a set have a non-random distribution.
If you make a set of numbers (for example set of all the numbers in today’s newspaper or brightness of objects recorded by Fermi space telescope) and keep only the first digits of these numbers; the frequency distribution of this new set of only first digits will follow this pattern:-
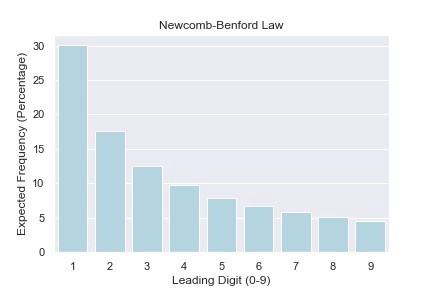
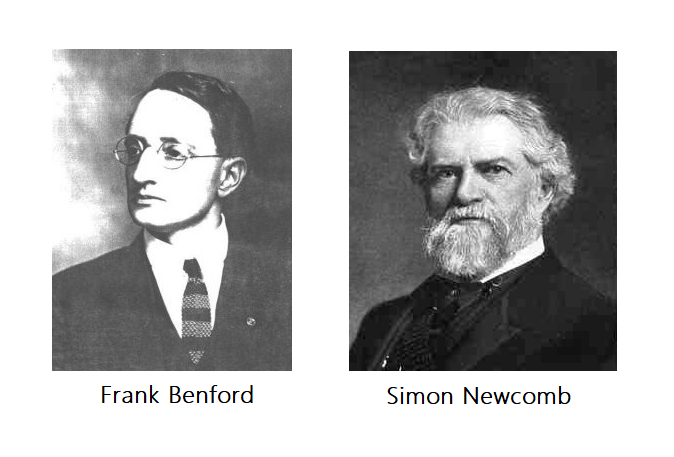
Newcomb was the first person to discover this pattern and it was rediscovered few decades later by Benford. To know the story of this discovery I recommend you watch E04: Digits; of Netflix’s short series Connected.
To understand why Benford’s Law exist in the first place, this Khan Academy video explains it the best.
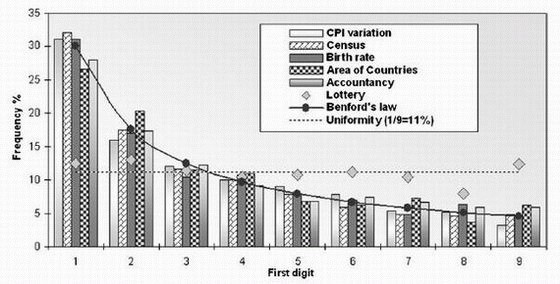
For every set of numbers chosen in a particular category, the distribution of first digits of those numbers in the set will obey the Benford’s Law. The only time they wont follow the law is when the data is fabricated.
Therefore, Benford’s Law is used by the income tax departments to detect accounting fraud, adopted by election commissions to check fairness of elections, detecting irregularities in prices, detecting deep fakes and other fraud/fairness use cases.
In the 2016 movie The Accountant, Ben Affleck’s character uses Benford’s law to expose the theft of funds from a robotics company. Benford’s law has been invoked as evidence of fraud in the 2009 Iranian elections.
Similarly, the macroeconomic data the Greek government reported to the European Union before entering the eurozone was shown to be probably fraudulent using Benford’s law, albeit years after the country joined.
In the era of machine learning, deep fake researchers are using Benford’s law to separate fake videos and images from the original ones and keeping the internet secure.
There is lot of literature and studies available to get the hang of Benford’s Law but simply put; for a set of numbers, the first digits of those numbers will follow a set pattern, time and again.
2. Electoral Data
We have used India and US election data for this study.
- General Election 2019 (India)
- General Election 2014 (India)
- State Constituency - Level Returns 2018 (USA)
3. MS Excel
The data will be downloaded as excel or csv files. We will use MS Excel to open these files, select final voter count columns, keep only first digit and build a frequency distribution table.
Feel free to use any other software (Google Sheets, LibreOffice, Numbers, etc), the process is same.
Process Tutorial
Step 1
Download and open the electoral file. Select the appropriate column.
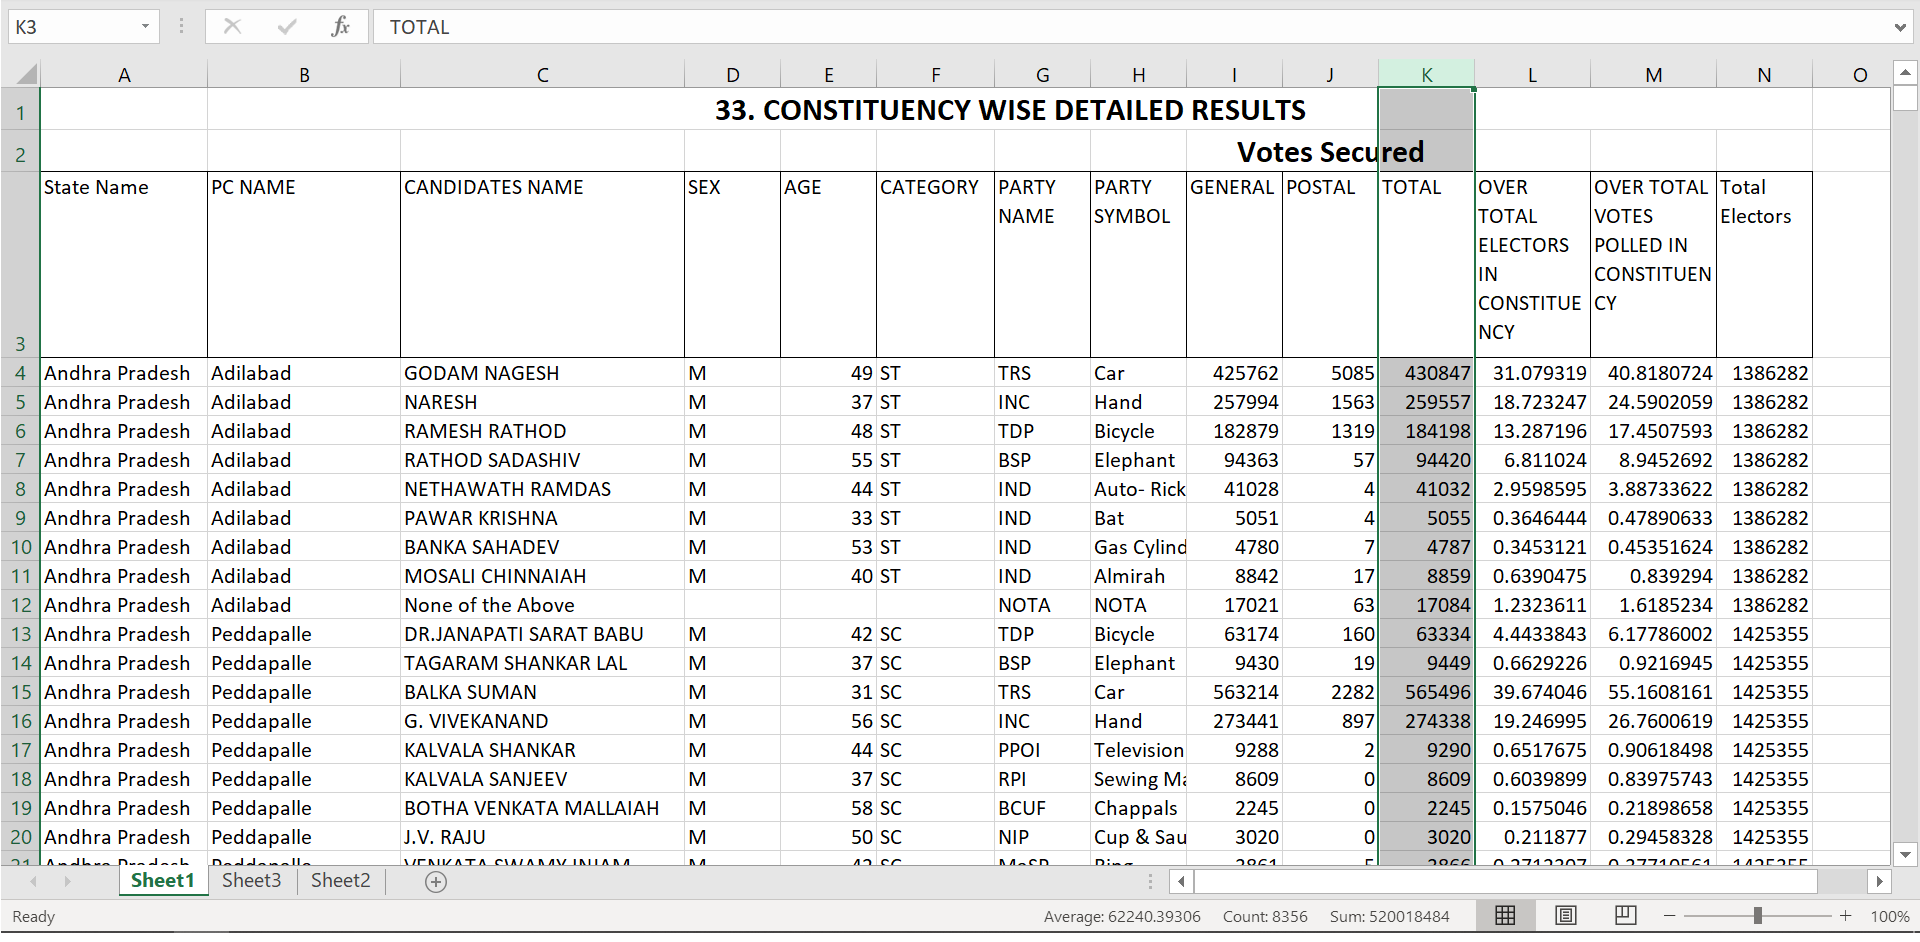
Below is a screenshot of one of the datasets from General Elections 2019 (India). Select the total votes secured column (as highlighted) and copy-paste it in a new sheet.
Step 2
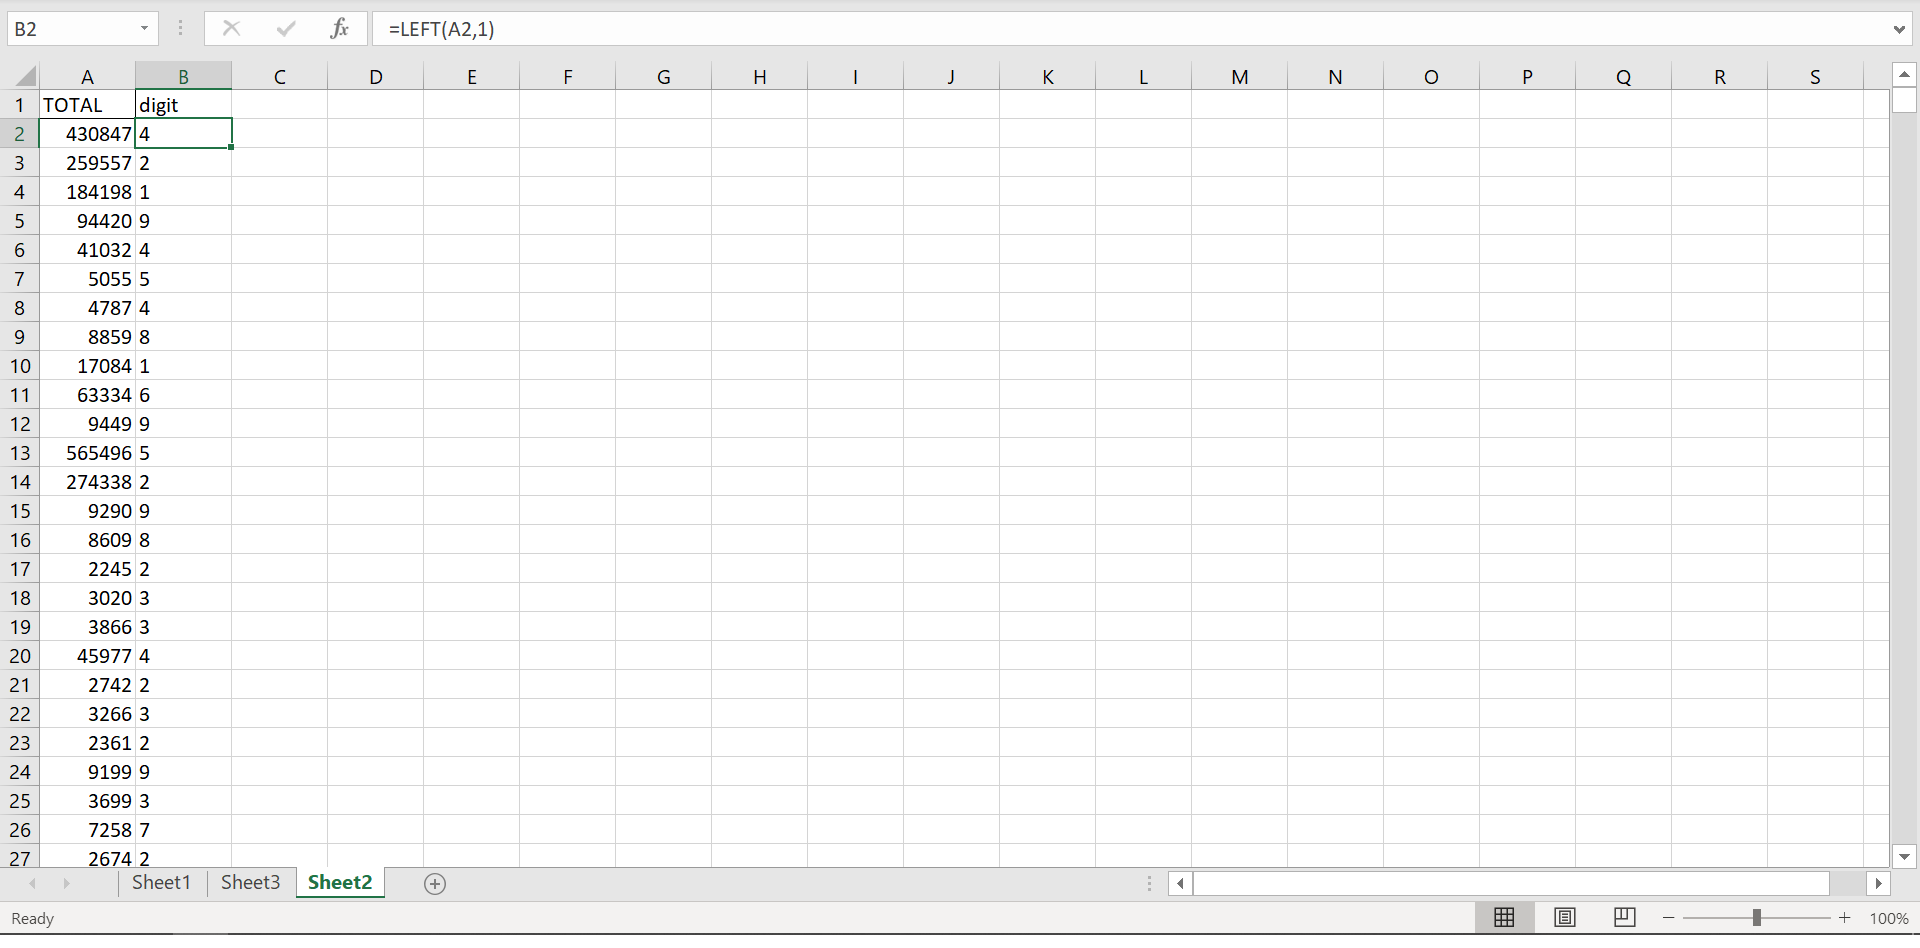
After pasting the selected column in a new sheet, create a new column B named “digit”.
For cell B2 Use the formula “=LEFT(A2,1)” and apply it to all the cells in column B to capture only the first digit of numbers in column A.
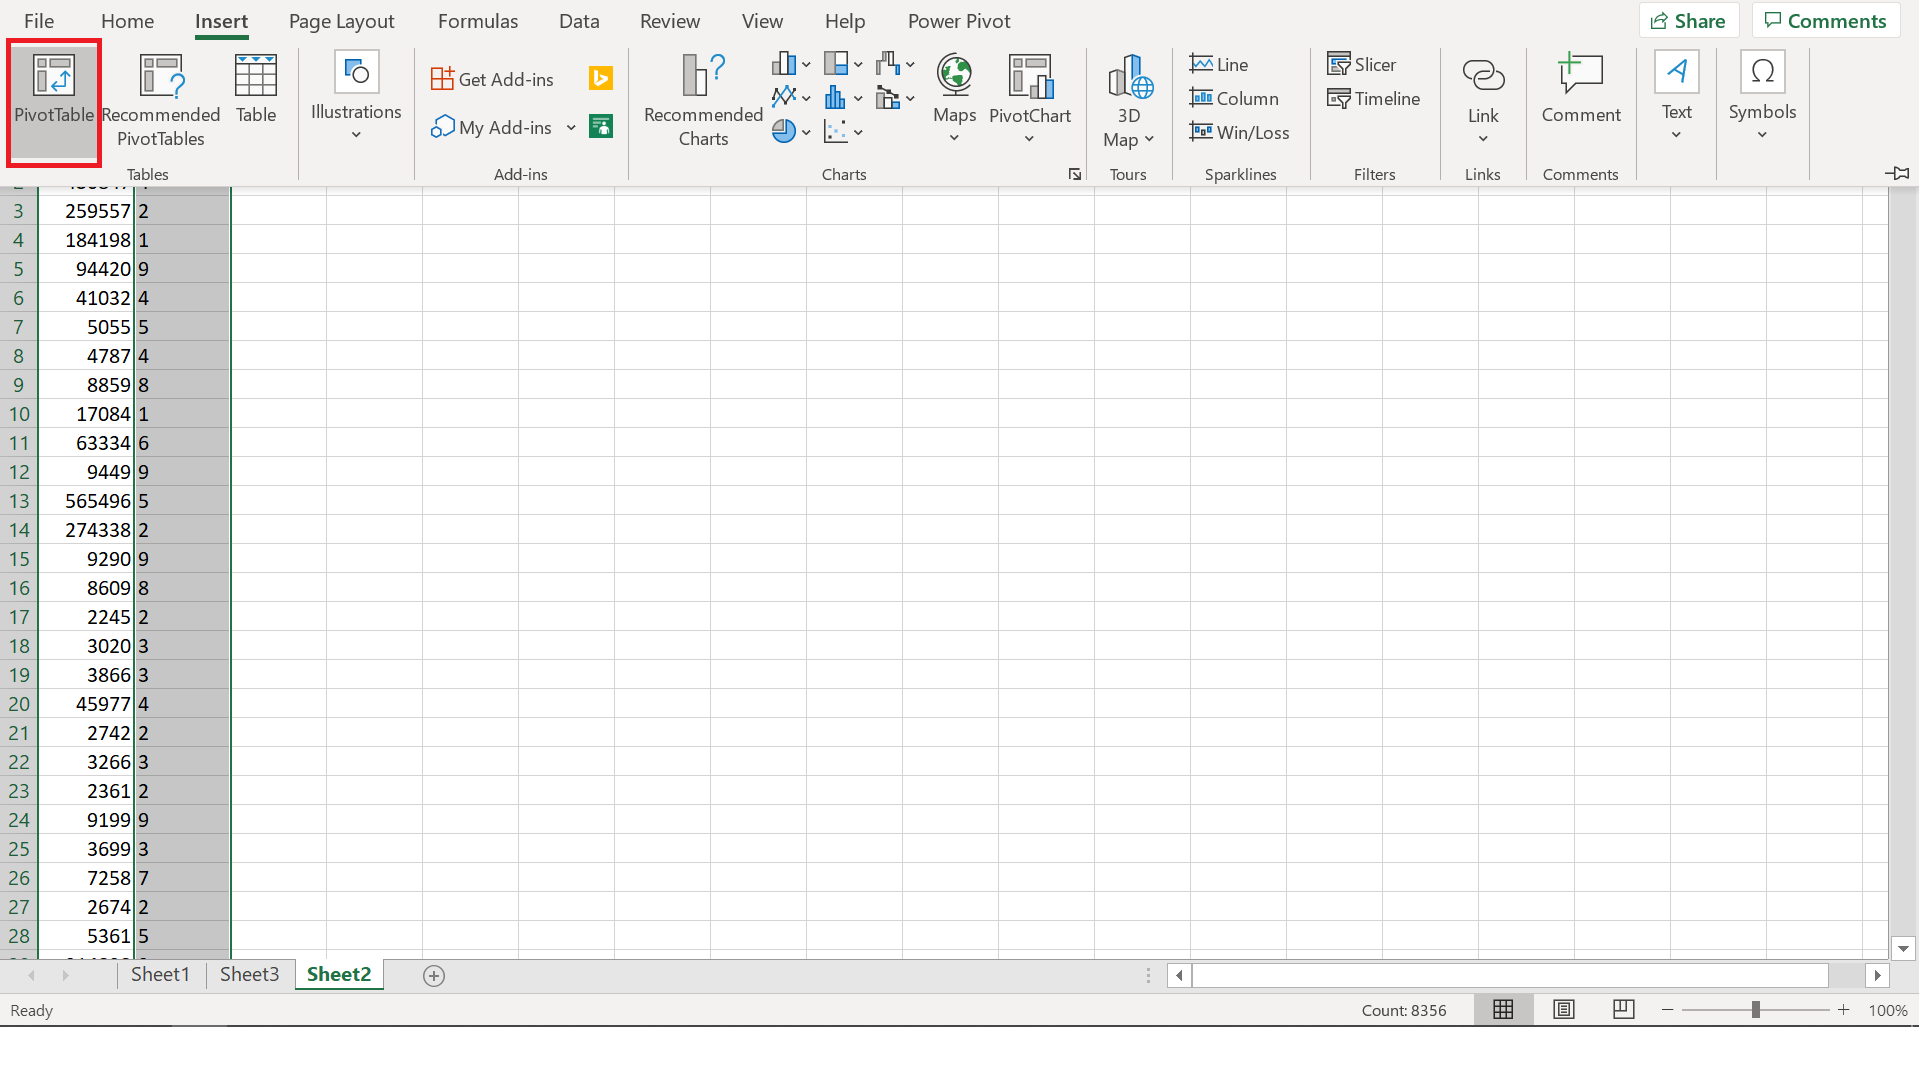
Now select the “digit” column, click on Insert tab in the menu, and click on Pivot Table. Just click OK on the dialogue box that appears.
Step 3
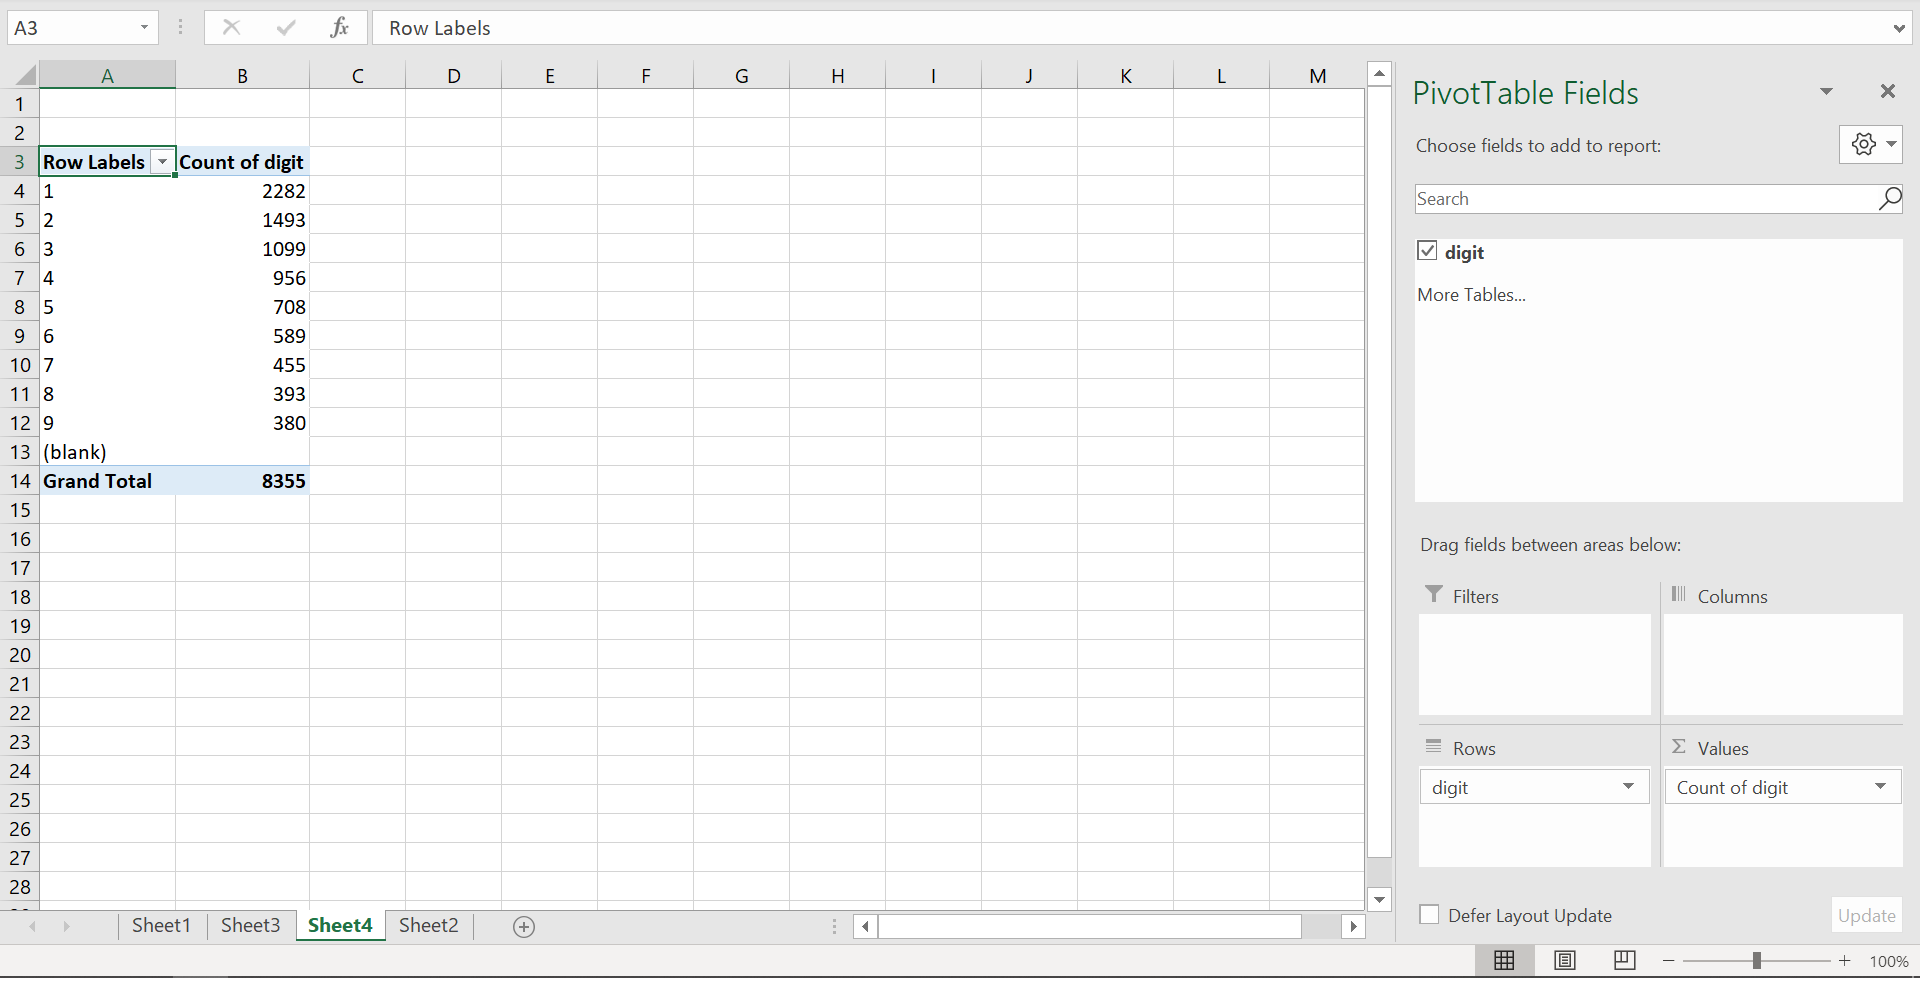
From the PivotTable Fields section on far right, drag and drop the “digit” label to “Rows” and “Values” sections at the bottom.
You will then obtain the digit distribution table as seen.
Step 4
Insert the 2D bar chart.
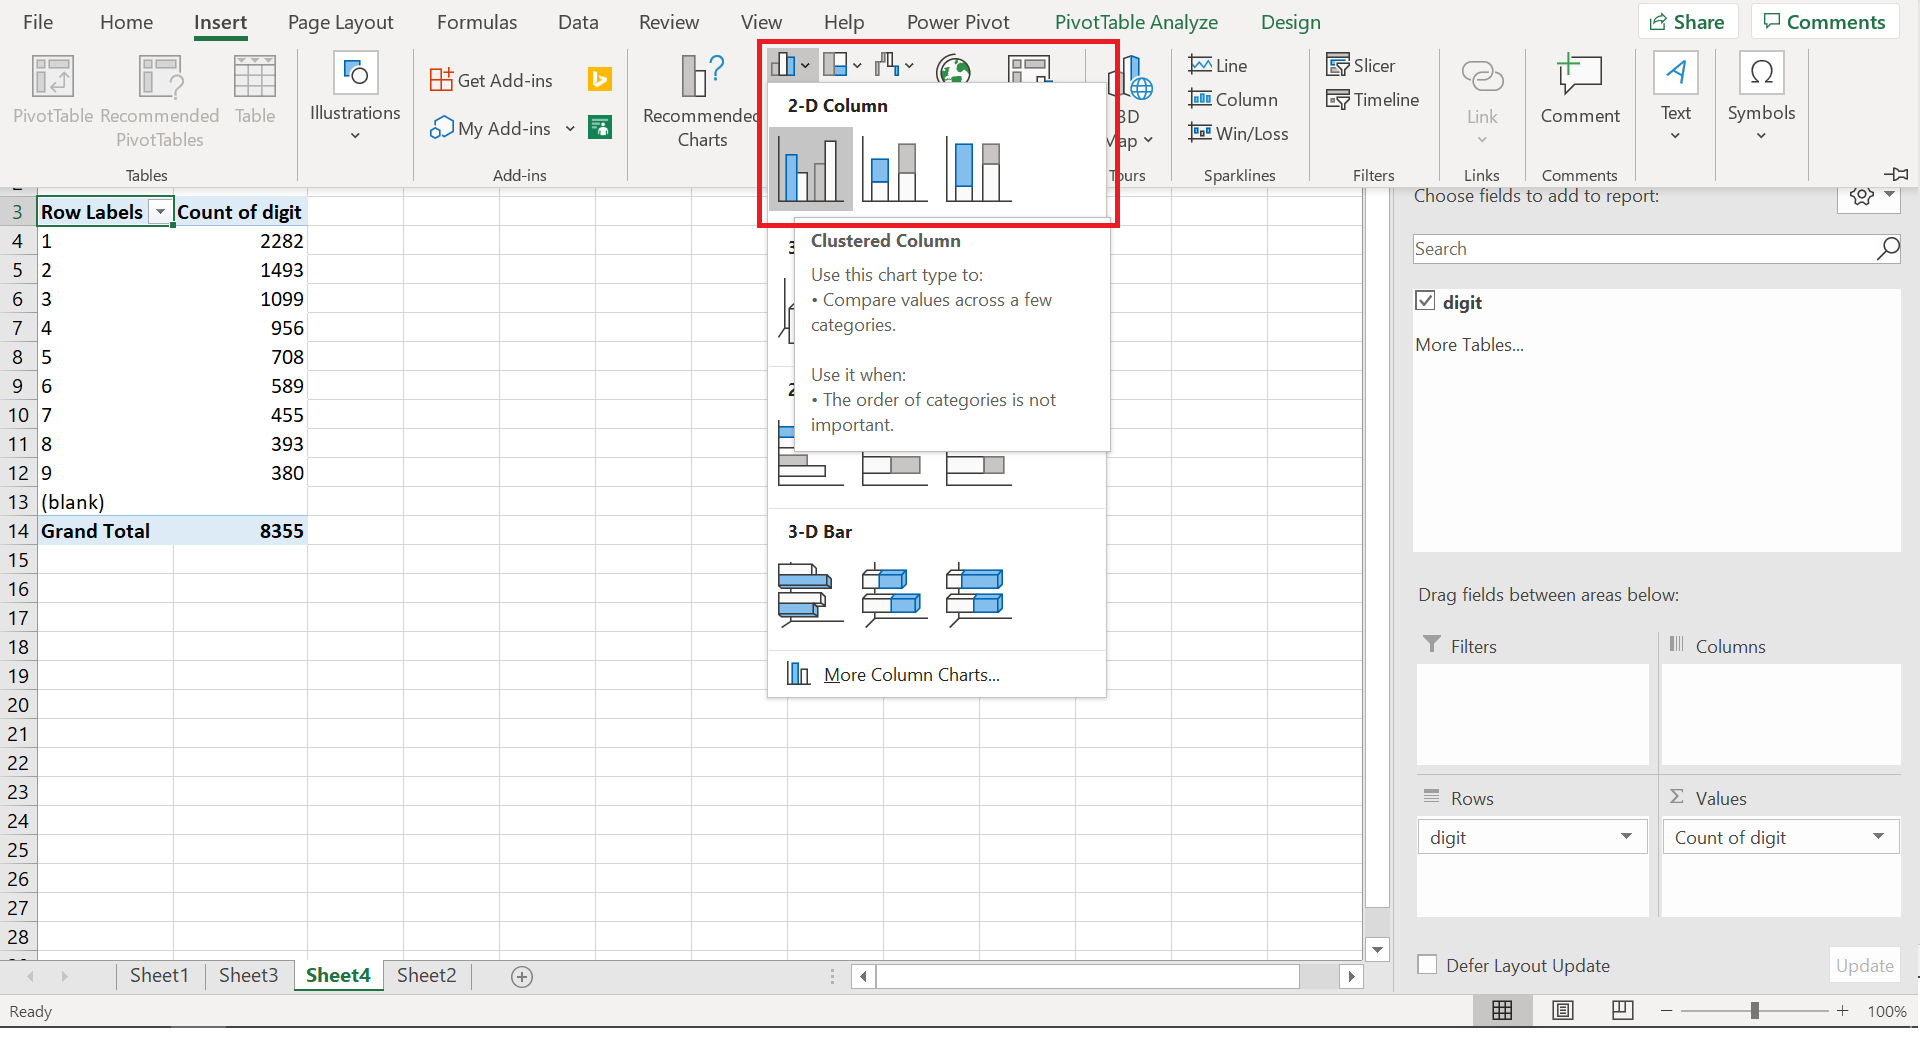
You will obtain the bar chart for distribution of first digits.
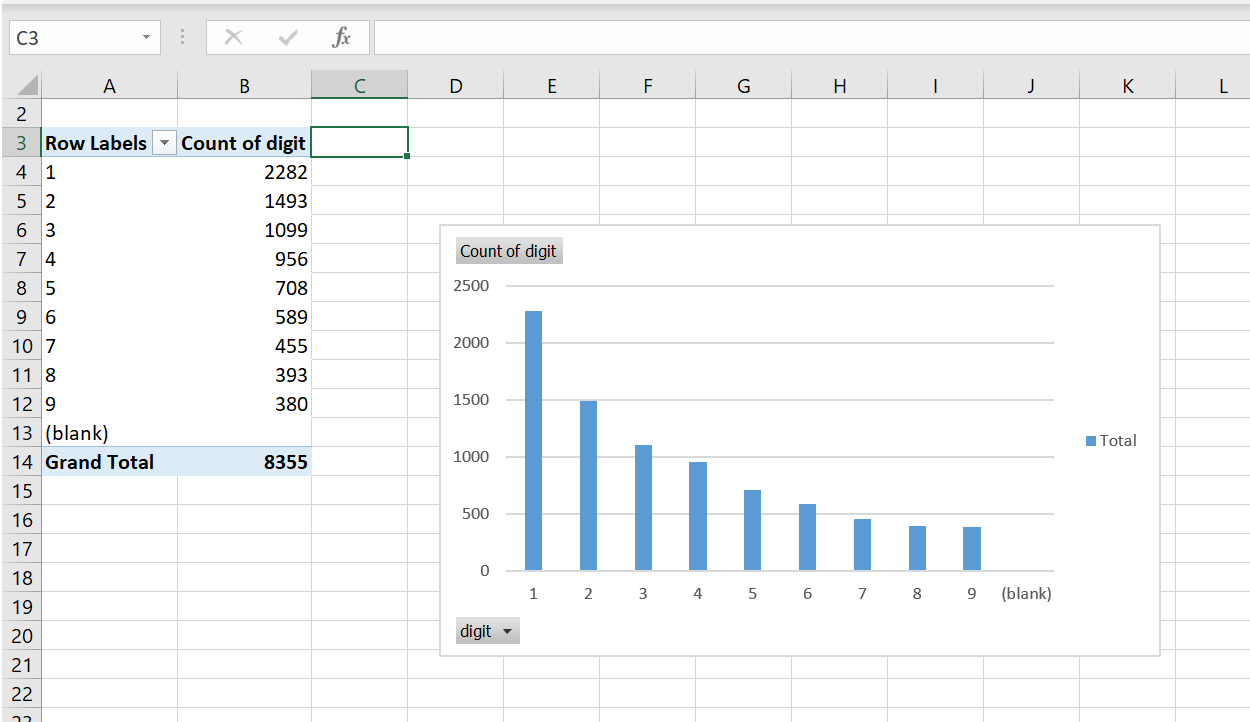
If the resultant chart follows Benford’s law pattern then it is safe to say that elections were fair. Deviation from this pattern may not say the same.
Election Fraud Analysis Results
1. General Election India 2019
Data Sources:
- State Wise Seat Won & Valid Votes Polled by Political Parties
- Constituency wise detailed result
- Details Of Assembly Segment Of Parliamentary Constituency (PC)
Result

Benford’s Law seems to be satisfied for datasets. Safe to conclude that the above mentioned election were fair.
2. General Election India 2014
Data Sources:
- State Wise Seat Won & Valid Votes Polled by Political Parties
- Constituency wise detailed result
- Details Of Assembly Segment Of Parliamentary Constituency (PC)
Result

Benford’s Law seems to be satisfied for datasets. Safe to conclude that the above mentioned election were fair.
3. State Constituency - Level Returns 2018 (USA)
Data Source:
The senate_overall_2018 and district_overall_2018 datasets, containing constituency level U.S. Senate and U.S. House election returns, respectively, are official and complete.
The state_overall_2018 and county_2018 datasets contain constituency level state office election returns and county level election returns for all offices, respectively.
The precinct_2018 dataset contains precinct level election returns for all offices.
Result

Benford’s Law seems to be satisfied for datasets. Safe to conclude that the above mentioned election were fair.
Conclusion
When in doubt, apply Benford’s Law
Benford’s Law has been used widely to detect fraud and irregularities across verticals. The innate quality of non-randomness within a set of numbers is mind blowing.
Whether you use it as magic trick to impress your friends or to figure out correctness of balance sheets while looking out for the next alpha in stock markets or to make a case for fairness of elections or to identify deep fakes, Benford’s Law is there to assist you.
Simple yet effective, from fraud detection to identifying deep fakes, Benford’s law is needed today more than ever. It’s simplicity makes it a perfect tool for citizen data scientists.
Bio: Rajat Gupta is a Data Science Practitioner.


